
For me the 2016 golf season is over. I don’t like playing when the temperature gets below 10 degrees celsius so its time to pack away the clubs and recap what happened in 2016.
Before I get to the 2016 data here is a brief overview of my handicap numbers for the last couple of years:
End of season handicap factor 2014 – 4.5, 2015 – 3.8, 2016 – 4.5
As indicated in an earlier post I entered my scores into the Golf Canada Handicap System using the hole by hole format, and I added a few basic stats, those being, number of putts and fairways hit.
Based on that the system generated considerable data. The first screen shot shows the results for “all courses” while the second and third screen give the results for Bridges and Wildewood the two courses where I play the majority of my games this year.
(You can click on the screenshot to enlarge them for easier reading.)
All Courses

Bridges

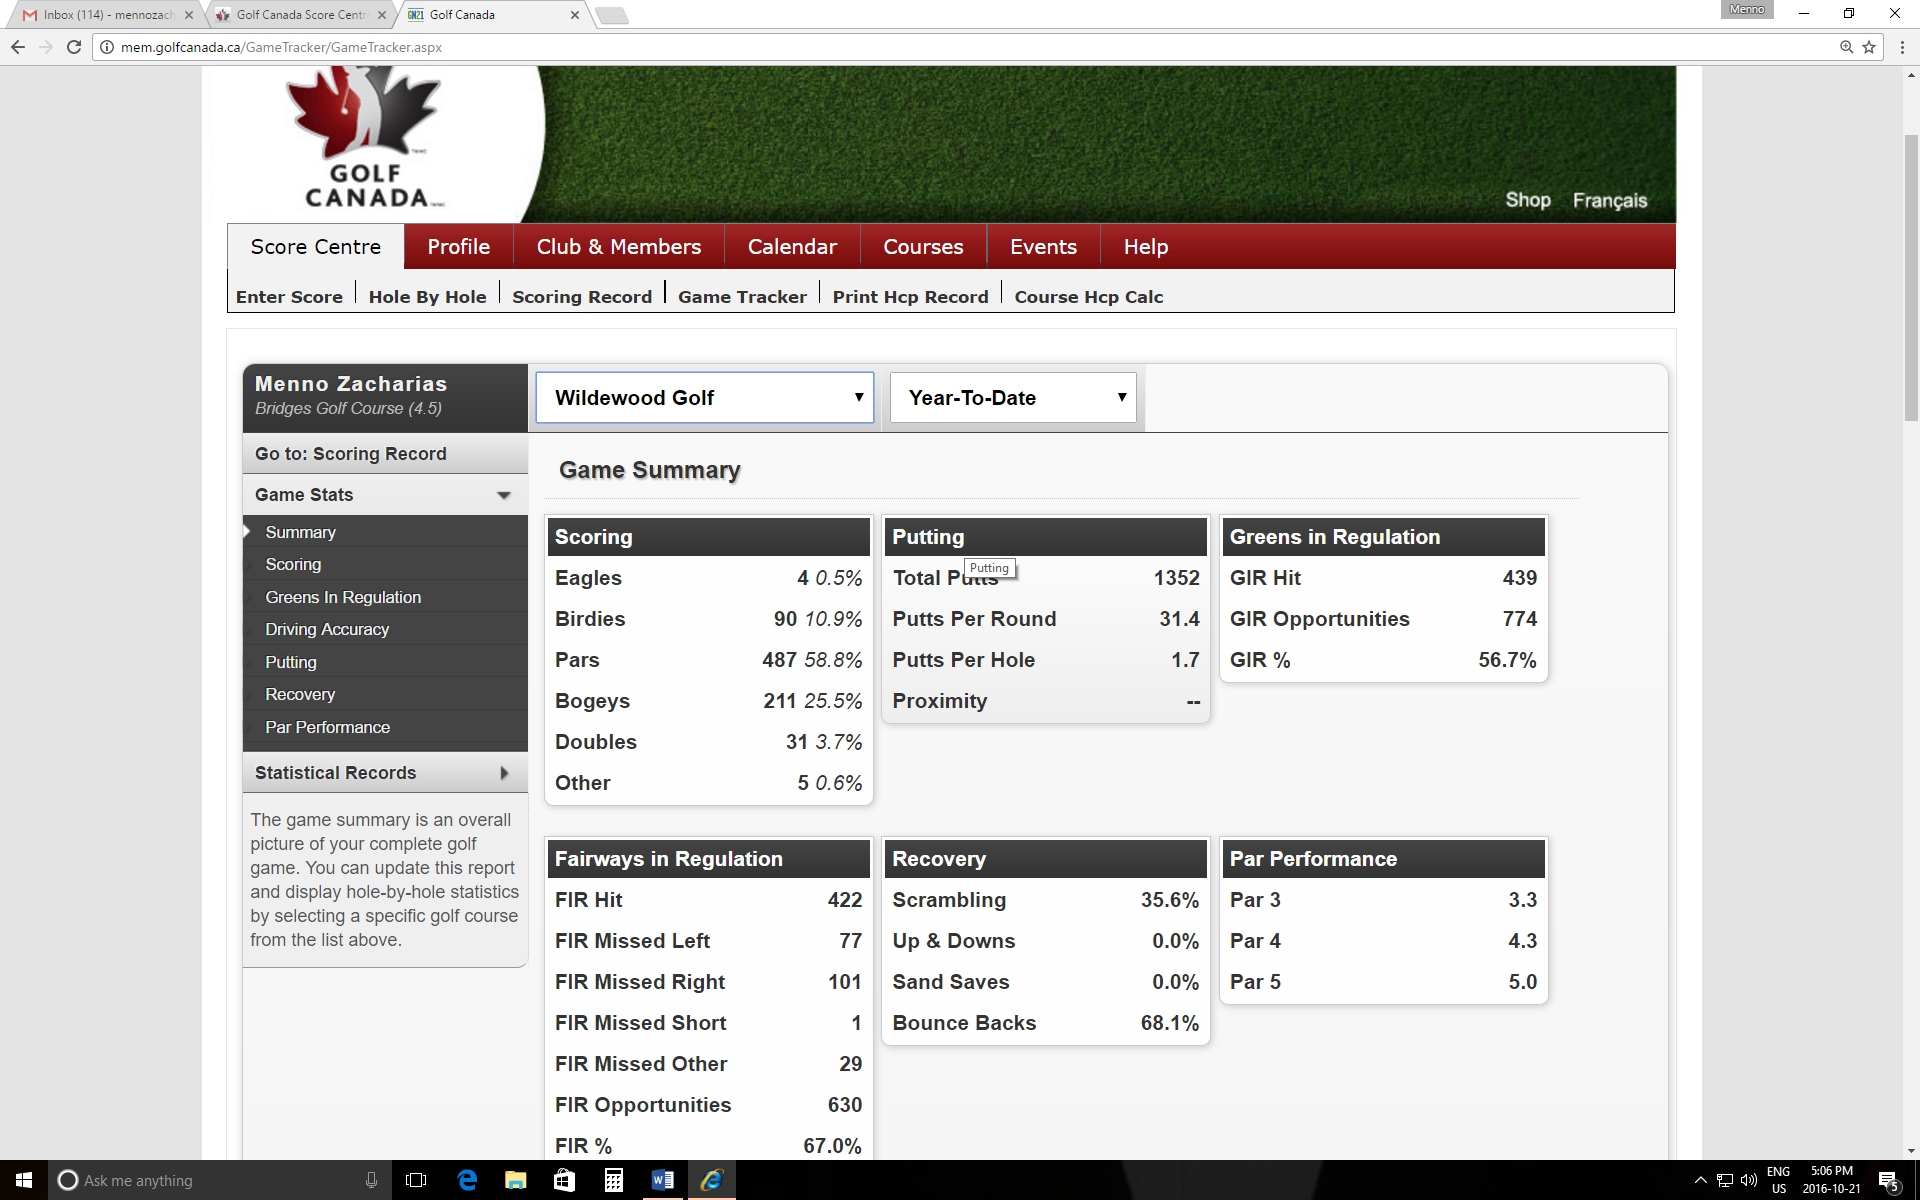
Wildewood
In subsequent posts I will attempt to interpret the data and determine if and how it can be used to direct practice, approaches on the course and hopefully overall game improvement.
