
Using statistics to reduce crime
During my years as the Deputy Chief of Police in Winnipeg I conducted extensive research on the statistical analysis of crime with a view to using statistical analysis as a basis for deployment of police resources and reducing crime. The research process involved not only a review of the academic literature on the topic but also meeting with Rudy Giuliani’s consulting group and members of the Manhattan Institute for Policy Research in New York City. Giuliani was the mayor of New York when Compstat was implemented there and the Manhattan Institute was the home of George Kelling who had become well known in policing circles when he proposed the “Broken Windows’ theory in 1982. I also visited Newark New Jersey, one of the many cities in the United States that had implemented programs based on the statistical analysis of crime and met with police officers there. Upon completion of the research I submitted a proposal ( click on ‘proposal’ and scroll down the agenda and click on item 85 for a copy of the report)to the City of Winnipeg and subsequently Crimestat was implemented in Winnipeg.
Using statistics to improve your golf game
During that same period of time I was a very active golfer and started thinking about applying some of the same principles used to reduce crime towards improving my golf game.
In my mind I called it Golfstat. As opposed to tracking where break-ins, car thefts and robberies were taking place and how to reduce them, Golfstat looked at where (on which holes) birdies, pars, bogies and double bogies were being scored with a view to coming up with a means to replicate the good holes and eliminate the bogies and double bogies.
The first step in the process was to gather data. For those interested in this approach an easy first step is to change the way you enter your handicap scores. As opposed to simply entering your gross adjusted score you start by entering your scores on a ‘hole by hole’ basis. The RCGA software allows for not only this but also facilitates the inclusion of other statistical information such as fairways hit, greens in regulation, number of putts and the like and then provides useful information based on the date entered.
The following shows the Golf Canada hole by hole entry screen:
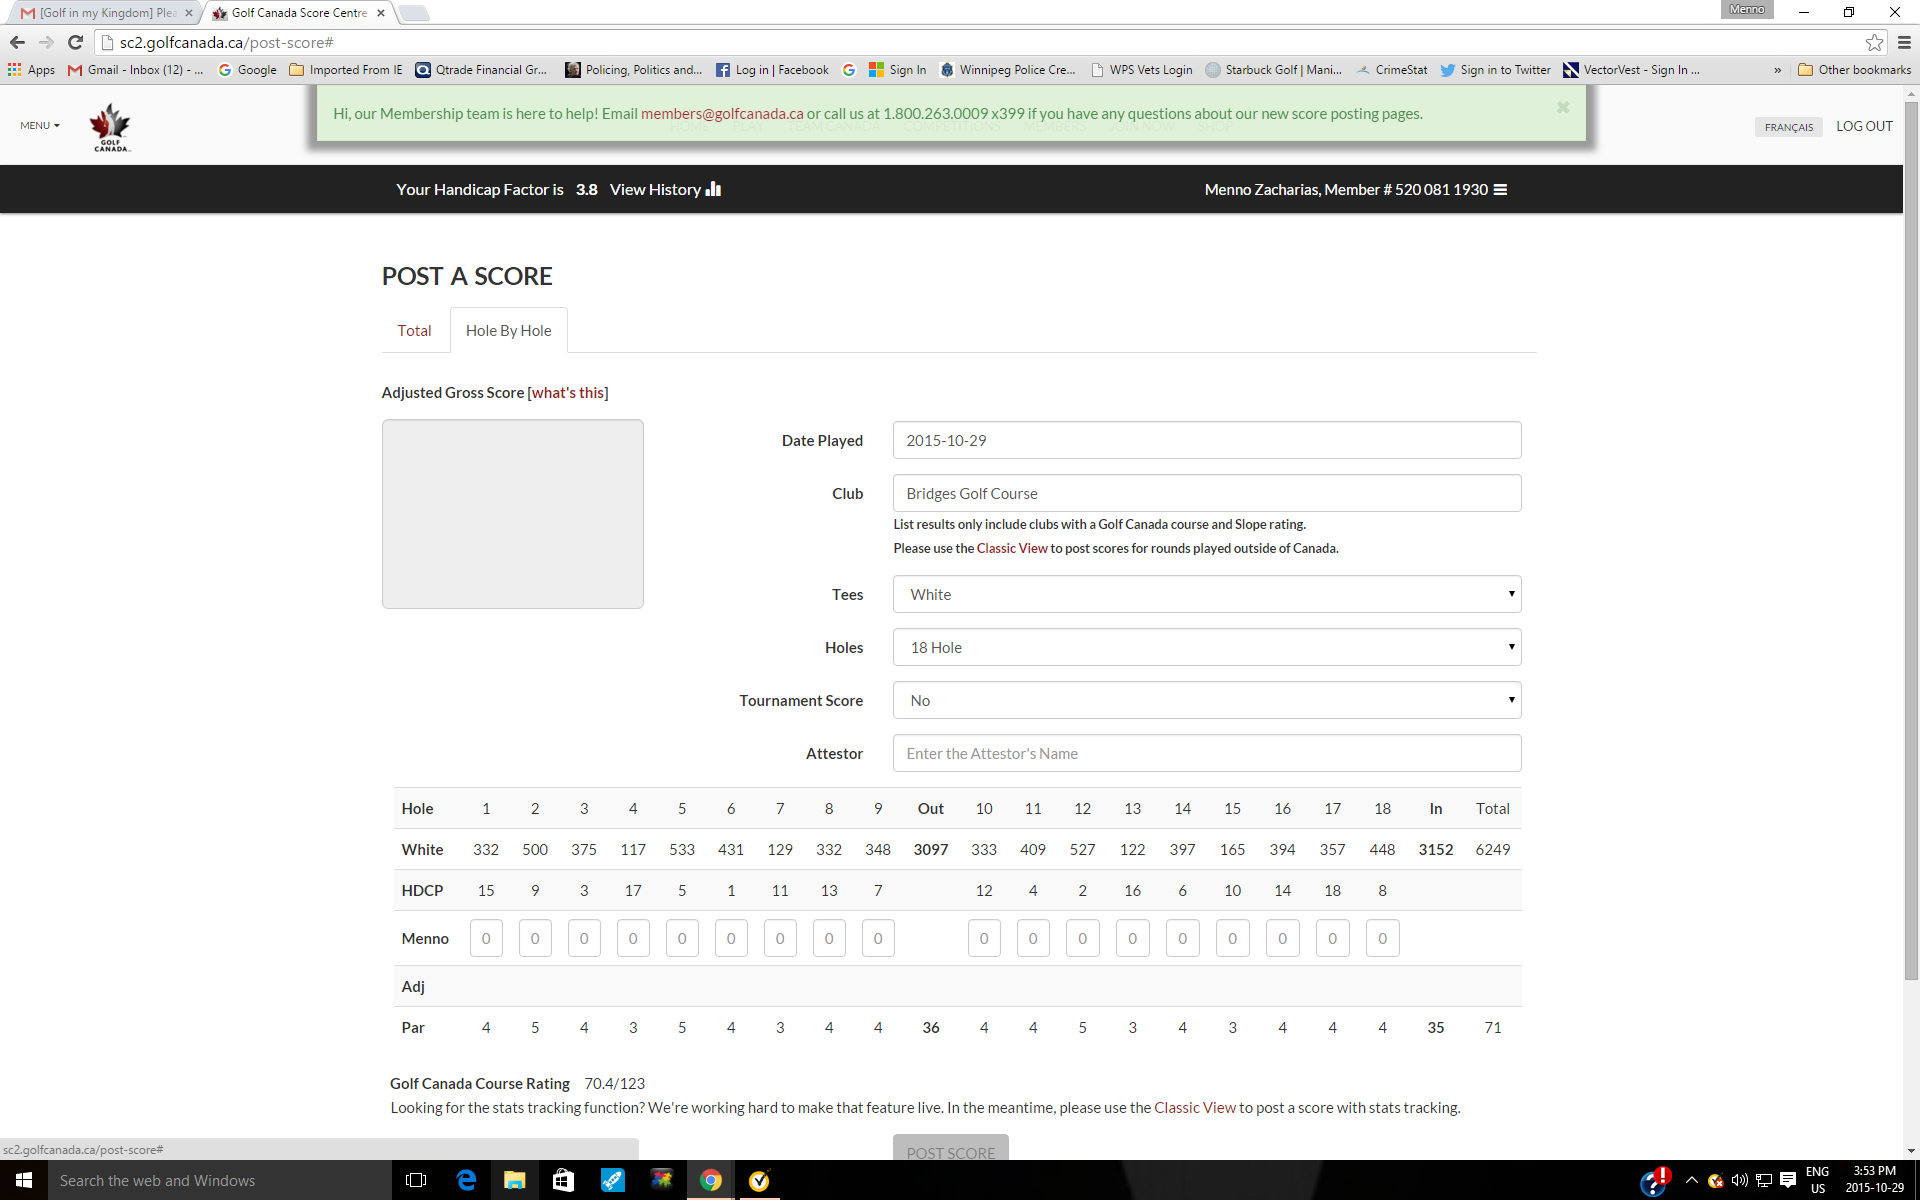
(click on image to enlarge)
Once you have entered sufficient data (ten games or so) you can start to do an analysis of the data and draw conclusions and formulate an action plan to improve your scoring.
A future post will examine some of the things the data tells you and how to use it to your advantage and improve your scoring.
Fore!
